We transform urban conflict into agreements that regenerate the city.
A participatory planning and territorial intelligence platform. We make public consultation a continuous and strategic process for governments and developers.
Schedule a Diagnostic Session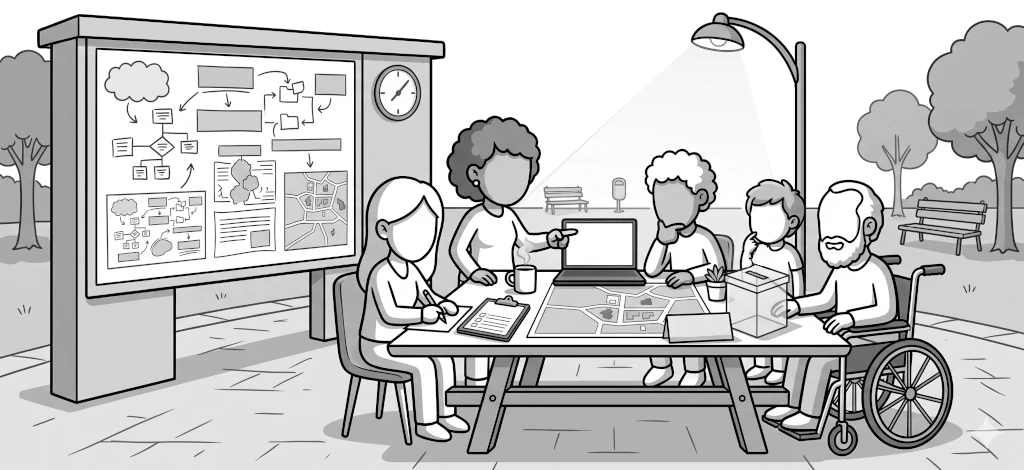
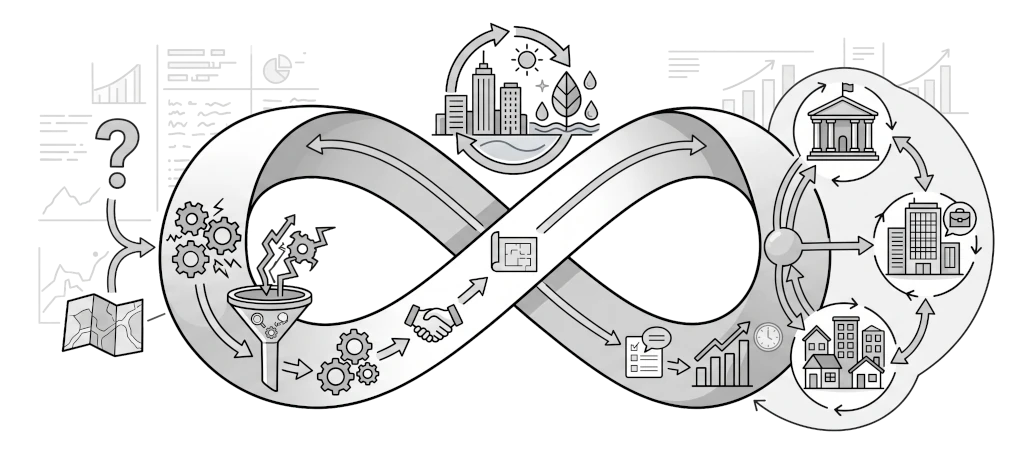
Methodology: The Science Behind the Agreement
A system only works if the people within it believe in it. Participatory processes are not just talks; they are complex information-gathering systems. We use spatial and demographic data analysis to map social friction and chart viable development strategies.
- Organizational audits and key stakeholder mapping.
- Geospatial and citizen sentiment analysis.
- Identification of friction zones and opportunity areas.

Private Sector: Viability and Development
We transform social risk into an asset for your development. We ensure that your infrastructure and urban design projects not only comply with regulations but are adopted, defended, and sustained by the community.
- Social viability strategies and risk mitigation.
- Community impact management for infrastructure projects.
- Regenerative urban design and placemaking.
Public Sector: Participatory Governance
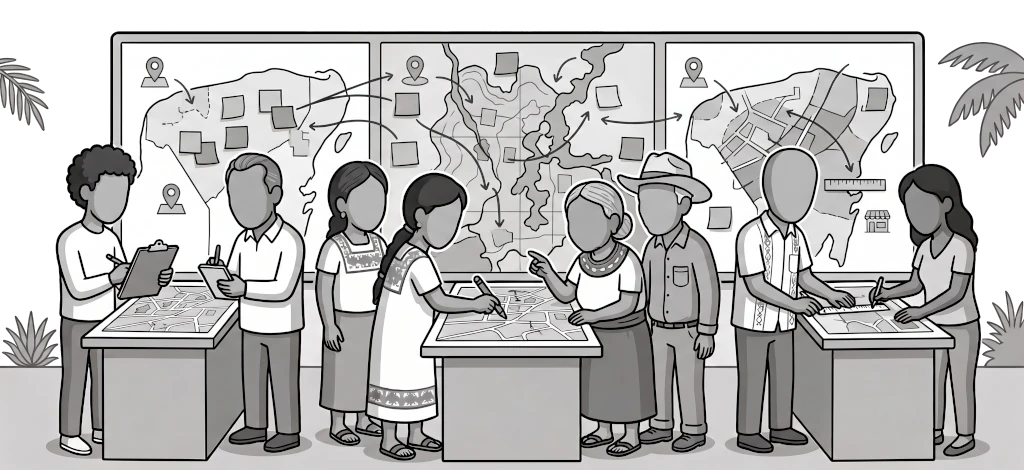
We bridge the gap between high-level policy and grassroots participation. We modernize local governance to design agile, efficient public policies deeply centered on the real needs of the environment.
- Strategic facilitation of urban development plans.
- Community mediation and conflict resolution.
- Design of participatory public policies informed by data.
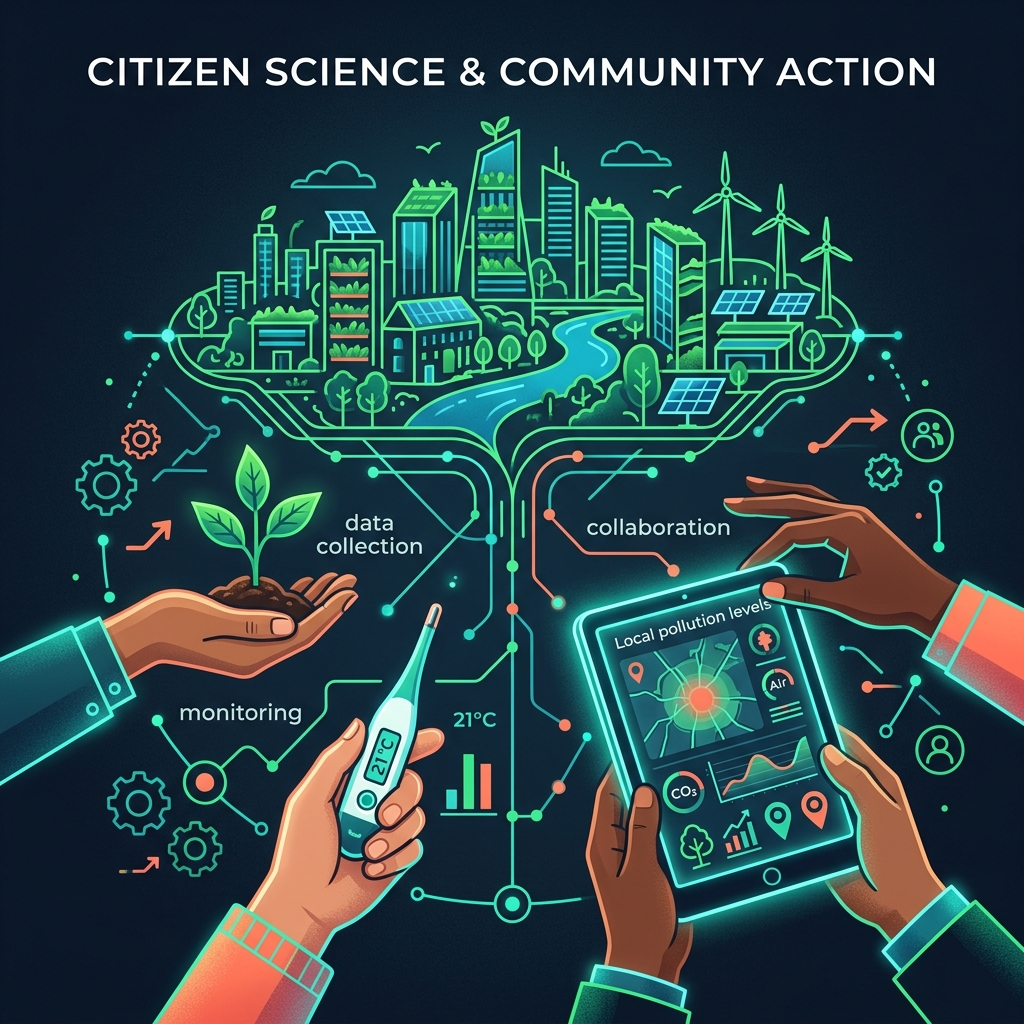
Technical Demonstration: Territorial Intelligence
Application example: Cross-referencing Landsat 8 satellite imagery and sociodemographic data to identify climate vulnerability and chart care routes in the city.
Mapas Térmicos de Calor (5x5 Regiones)
Visualización abstracta de anomalías de temperatura. Los tonos oscuros representan temperaturas críticas superiores a 42°C.
Índice de Vulnerabilidad vs Jefaturas Femeninas
Correlación estadística entre áreas con alta concentración de labores de cuidado y anomalías térmicas en Cancún.
What Our Community Says
Discover how PAAKTO’s participatory processes have transformed the way neighbors collaborate and adapt to climate change in Cancun.
Participating in PAAKTO’s co-design tables allowed us to explain how we walk under the sun at noon with our children. For the first time, we were heard and shade was designed where it is truly needed.
María Elena Torres
Neighbor and Caretaker, Region 259
PAAKTO’s methodology combines the technical rigor of satellite data with exceptional community field work. It is an ideal metropolitan governance model for climate change adaptation.
Dr. Alejandro Gómez
Urban Development & Climate Researcher
At first, we were worried that trees would block our shops. But with PAAKTO’s data, we understood that a shaded corridor will attract more pedestrians and reduce the unbearable heat on the sidewalk.
Carlos Mendoza
Merchant on Av. López Portillo
Ready to co-design and cool your community?
Join our public consultation initiatives, share your observations, or propose critical zones for satellite thermal monitoring in Cancun.
Read Our Blog 📖